Tools
Available Tools
- teen-SPARC 2.0 STI Prevention and Risk Calculator
- Projected Percentage Reductions in TB Incidence, 2016-2025 for key populations in California, Florida, New York and Texas
- teen-SPARC STI Prevention and Risk Calculator
- State-Level Heterogeneity of Tuberculosis Incidence by Risk Factor in the United States
- Estimates of Persons with Indications for Preexposure Prophylaxis (PrEP): A Web-Based Modeling Tool for Public Health Practice
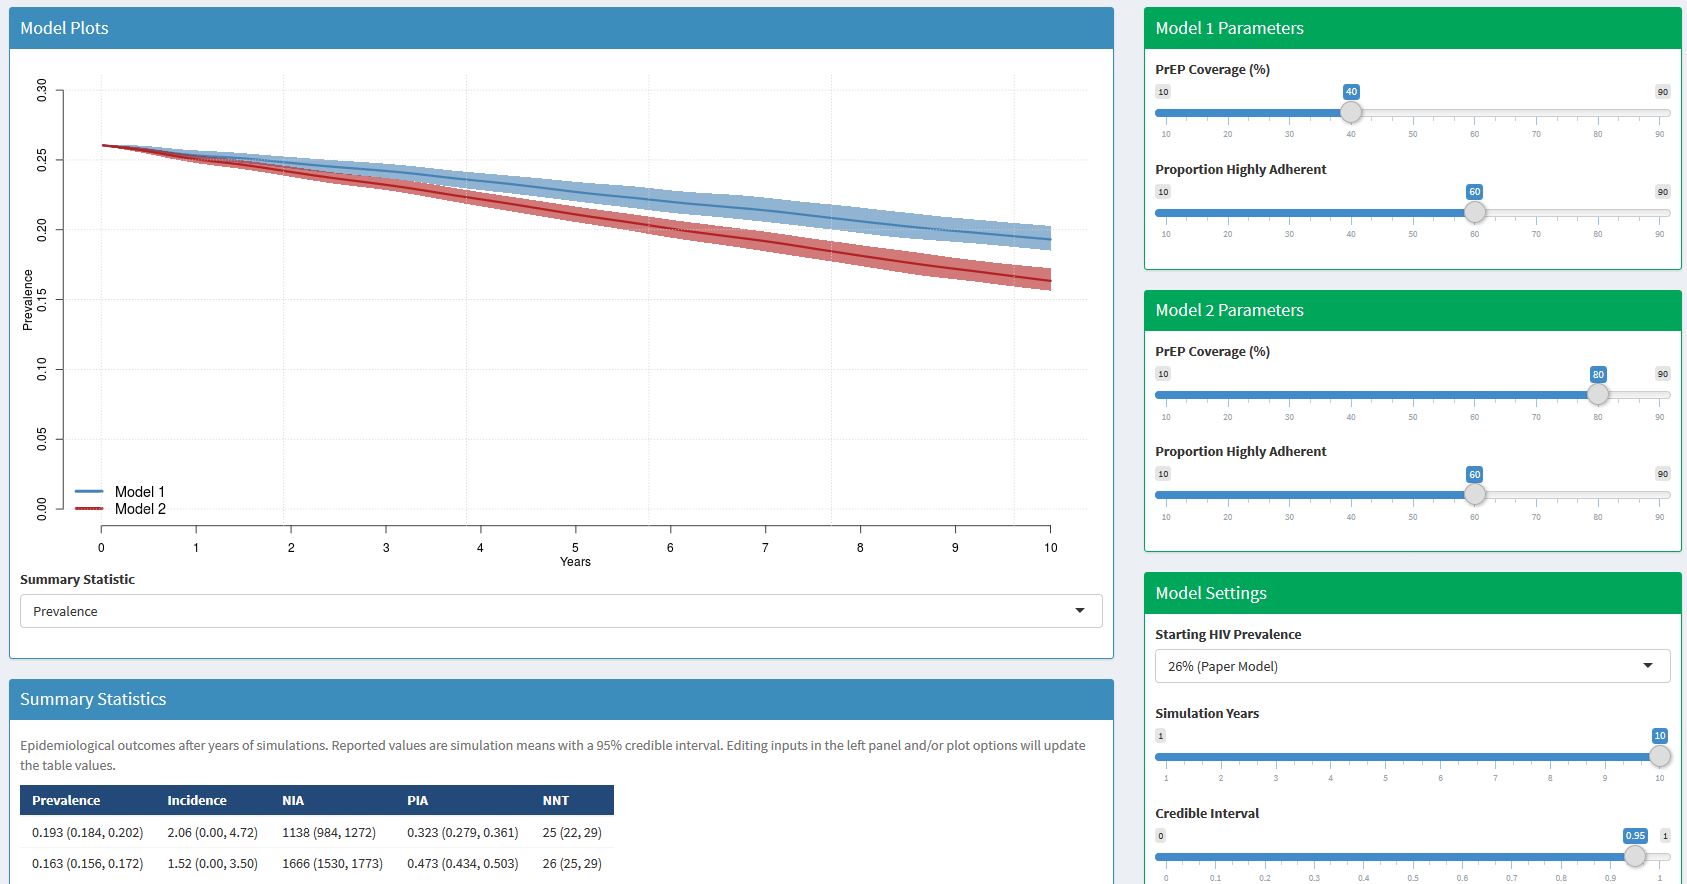
- Impact of HIV Pre-Exposure Prophylaxis among MSM in the United States: A Web-Based Modeling Tool for Public Health Practice
teen-SPARC 2.0: STI Prevention and Risk Calculator
The teen-SPARC Excel tool is designed to help public health jurisdictions and other entities explore the potential impact of behavior change on reducing sexually transmitted infections (STIs) and pregnancies among the sexually active high school-attending adolescent population. Version 2.0 represents a major expansion of functionality relative to version 1.0. Additions specific to 2.0 are in bold:
- Conditions modeled include gonorrhea (Neisseria gonorrhea), chlamydia (Chlamydia trachomatis), HIV (human immunodeficiency virus), and pregnancies.
- The tool models three age groups (13-15 year olds, 16-17 year olds, and 18 year olds)
- It includes three “sexual partnering groups” (SPGs): males who have sex with males (MSM), males who have sex with females only (MSF), and females who have sex with males (FSM). For HIV, only MSM are modeled, and for pregnancies, only FSM.
- It estimates both cases averted and costs averted.
- Forms of behavioral change that can be explored for their impact include changes in: age at first sex, STI screening, PrEP (for HIV), condom use (for STIs), and contraception use (for pregnancies).
The tool integrates data from the Youth Risk Behavior Surveillance System (YRBS) and can also be useful to jurisdictions who do not have local YRBS data, and who either have alternative data sources or who wish to explore what-if scenarios.
teen-SPARC 2.0 Excel teen-SPARC 2.0 Quick Start teen-SPARC 2.0 Manual teen-SPARC 2.0 SAS teen-SPARC 2.0 ZIP (All Files)
teen-SPARC Training Training was initially developed for version 1.0; however, it can still be used to learn the basic functionality that is shared with version 2.0.
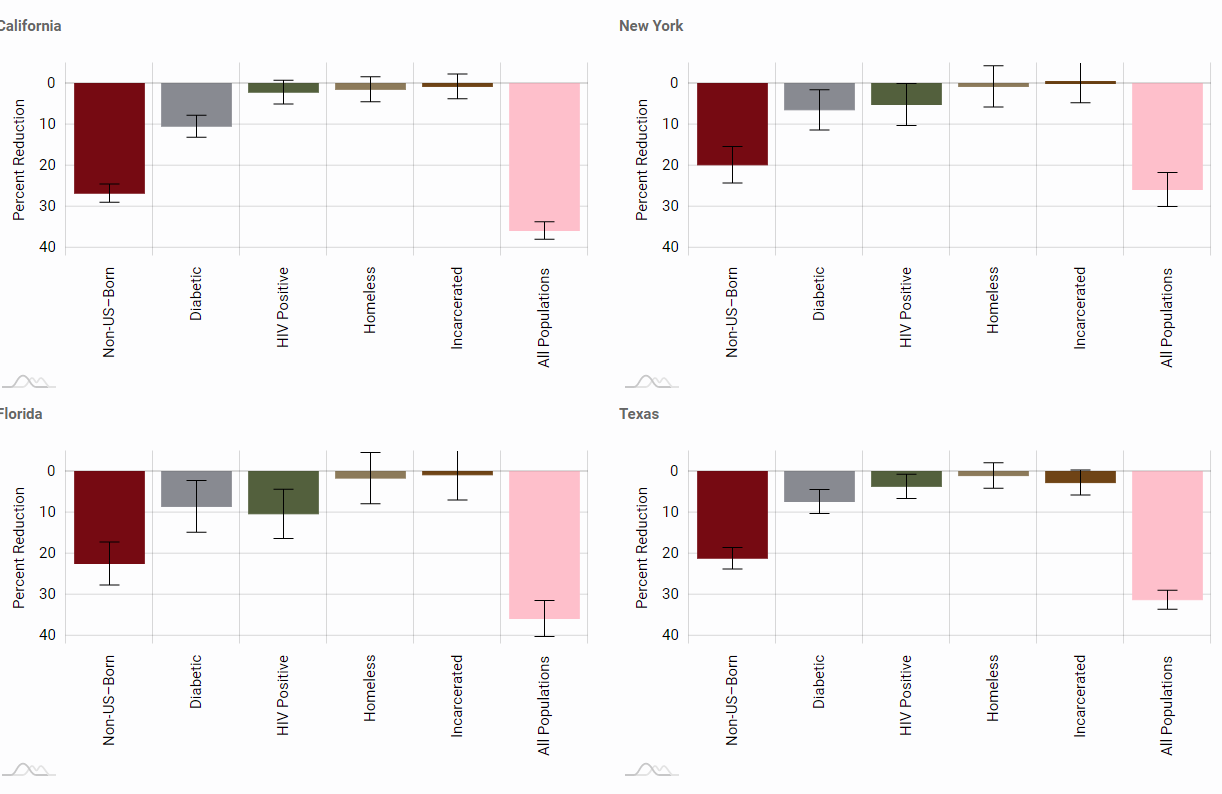
Projected Percentage Reductions in TB Incidence, 2016-2025 for key populations in California, Florida, New York and Texas
This tool is a web application that shows the projected impact of increased targeted testing and treatment on tuberculosis incidence among different high-risk populations in the four states: California, Florida, New York and Texas. The charts shown in this tool are based on calculations from reported TB incidence data in the United States. They can be used to understand differences in the impact of TTT across high-risk groups in each of four states.
Depending on the requirements of TB controllers in each state, this tool can:
1. Illustrate the potential impact of increased targeted testing and treatment on TB incidence among key populations;
2. Highlight projected between-state differences in TB reduction under TTT to inform TB elimination programs.
teen-SPARC STI Prevention and Risk Calculator
The teen-SPARC Excel tool is designed to help public health jurisdictions and other entities explore the potential impact of behavior change on reducing sexually transmitted infections (STIs) among the sexually active high-school-attending adolescent population. It focuses on three STIs: gonorrhea (Neisseria gonorrhea), chlamydia (Chlamydia trachomatis), and HIV (human immunodeficiency virus). It includes three age groups (13-15 year olds, 16-17 year olds, and 18 year olds) and three “sexual partnering groups” (SPGs): males who have sex with males (MSM), males who have sex with females only (MSF), and females who have sex with males (FSM). For HIV, only MSM are modeled.
The tool integrates data from the Youth Risk Behavior Surveillance System (YRBS) and can also be useful to jurisdictions who do not have local YRBS data, and who either have alternative data sources or who wish to explore what-if scenarios. Defaults are derived mostly from the 2015 national YRBS. Key outputs include the expected number of new infections and diagnoses in the next year among high-school-attending adolescents (for base scenarios), and the change in these relative to a base scenario (for intervention scenarios).
The TeenSPARC tool has been updated to TeenSPARC 2.0. if you have any questions regarding the original TeenSPARC tool, please contact Seve Goodreau (goodreau@uw.edu).
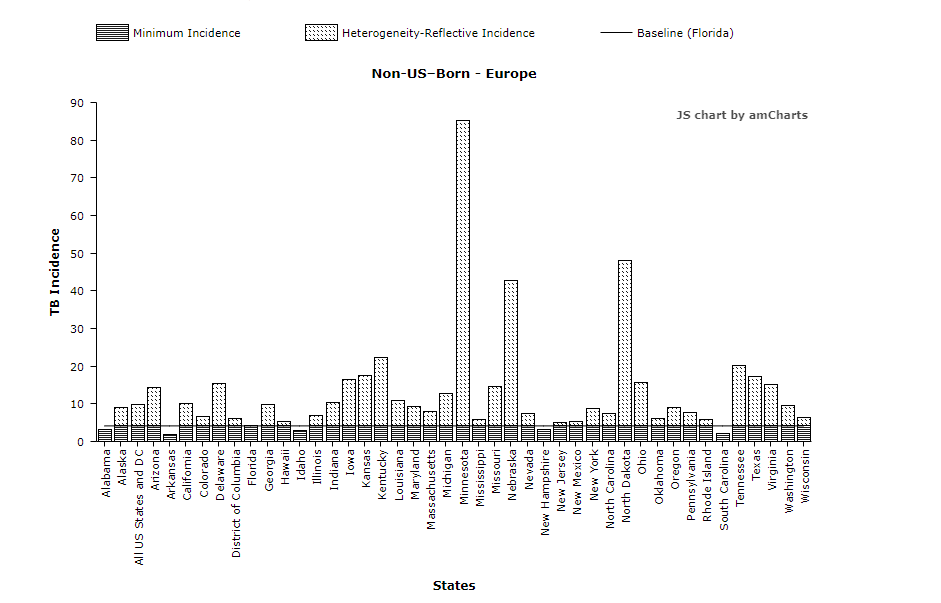
State-Level Heterogeneity of Tuberculosis Incidence by Risk Factor in the United States
This tool is a web application that shows the amount of "heterogeneity" of tuberculosis incidence for different high-risk populations. Tuberculosis (TB) is a disease caused by bacteria that are spread from person to person through the air. TB usually affects the lungs, but it can also affect other parts of the body, such as the brain, the kidneys, or the spine. In most cases, TB is treatable and curable; however, people with TB can die if they do not get proper treatment.
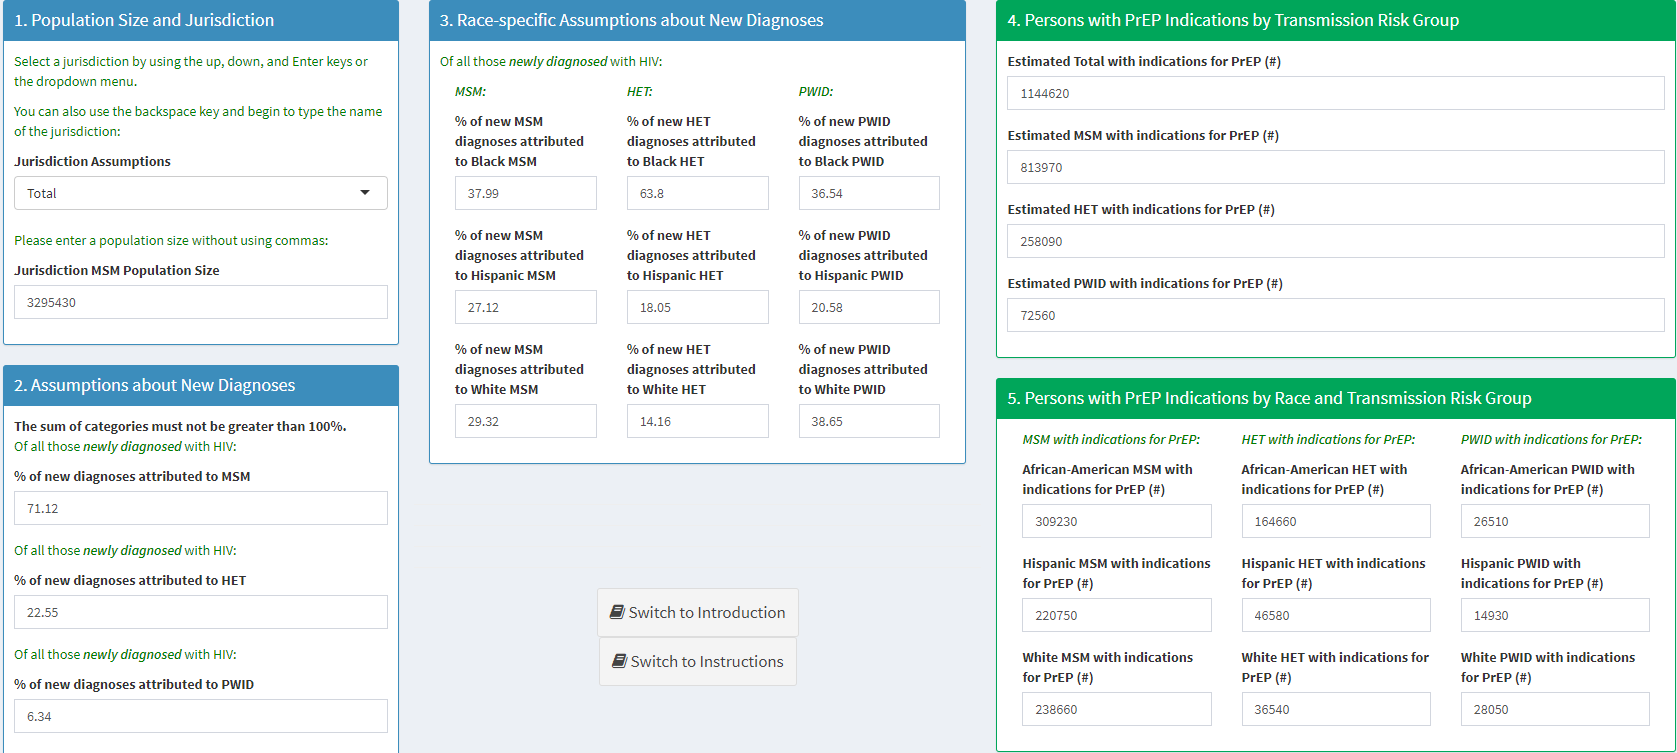
Estimates of Persons with Indications for Preexposure Prophylaxis (PrEP): A Web-Based Modeling Tool for Public Health Practice
This web-tool provides users the ability to estimate the number of individuals indicated for PrEP. This includes estimates by transmission risk group and estimates by race. This software tool provides additional opportunities to explore the estimates from the paper, “Estimates of Persons with Indications for Preexposure Prophylaxis by Jurisdiction Transmission Risk Group, Race and Ethnicity.” Smith DK, Van Handel M, Grey J. Estimates of Persons with Indications for Preexposure Prophylaxis by Jurisdiction Transmission Risk Group, and Race/Ethnicity, United States, 2015. Annals of Epidemiology, 2018.